
I noticed that my router’s clock was about half an hour off, so I decided to configure NTP. However, it proved much more frustrating that I though, due mainly to my impatience.
In this article I hope to explain to you why you need multiple NTP servers and how to interpret the output of the show ntp associations command as we explore the workings of NTP on a Cisco router.
Note: Jeremy Stretch has a great article on configuring NTP
NTP and the software clock
Firstly, I already knew that NTP wasn’t going to work if my clock was too far out of sync, so I set my clock to something close to the correct time using the privileged clock set command. (This article tells me that my clock needs to be within 4000 sec=66 min, so I should have been OK). Next, I configured NTP using the ntp server pool.ntp.org command, and checked to see if my router had synchronised its time:
router#show ntp association

  address         ref clock       st   when   poll reach  delay  offset   disp
 ~27.54.95.11     .INIT.          16      -     64     0  0.000   0.000 15937.
 * sys.peer, # selected, + candidate, - outlyer, x falseticker, ~ configured

router#show ntp status
Clock is unsynchronized, stratum 16, no reference clock
nominal freq is 250.0000 Hz, actual freq is 250.0000 Hz, precision is 2**32
reference time is 00000000.00000000 (10:00:00.000 UTC+10 Mon Jan 1 1900)
clock offset is 0.0000 msec, root delay is 0.00 msec
root dispersion is 0.00 msec, peer dispersion is 0.00 msec
loopfilter state is 'FSET' (Drift set from file), drift is 0.000000000 s/s
system poll interval is 64, never updated.
What? No synchronisation? NEVER updated??? But I’ve been waiting more than two minutes now!! Being impatient, I decided that I should perhaps add another server, to see if that would speed things up. So I added:
ntp server 0.au.pool.ntp.org
ntp server 1.au.pool.ntp.org
ntp server 3.au.pool.ntp.org
ntp server 2.au.pool.ntp.org
And got:
router#show ntp association

  address         ref clock       st   when   poll reach  delay  offset   disp
 ~27.54.95.11     .INIT.          16      -     64     0  0.000   0.000 15937.
 ~130.102.128.23  .INIT.          16      -     64     0  0.000   0.000 16000.
 ~128.184.34.53   .INIT.          16      -     64     0  0.000   0.000 16000.
 ~129.250.35.250  .INIT.          16      -     64     0  0.000   0.000 16000.
 ~129.250.35.251  .INIT.          16      -     64     0  0.000   0.000 16000.
 * sys.peer, # selected, + candidate, - outlyer, x falseticker, ~ configured

router#show ntp status
Clock is unsynchronized, stratum 16, no reference clock
nominal freq is 250.0000 Hz, actual freq is 250.0000 Hz, precision is 2**32
reference time is 00000000.00000000 (10:00:00.000 UTC+10 Mon Jan 1 1900)
clock offset is 0.0000 msec, root delay is 0.00 msec
root dispersion is 0.01 msec, peer dispersion is 0.00 msec
loopfilter state is 'FSET' (Drift set from file), drift is 0.000000000 s/s
system poll interval is 64, never updated.
Still no synchronisation. But then I noticed in Jeremy’s article a note that said:
For a protocol so obsessed with correct time, NTP certainly is slow: it can take upwards of five minutes to synchronize with an upstream server. This is due to the NTP poll timer of 64 seconds.
So I decided to find out a bit more about this poll timer and how it works. Firstly, it turns out that adding the extra NTP servers was a good idea. NTP doesn’t just take the first timestamp packet it sees to set the clock. Instead, it build a database of information built up from successive polls to multiple servers. I found this diagram that gives a nice picture: 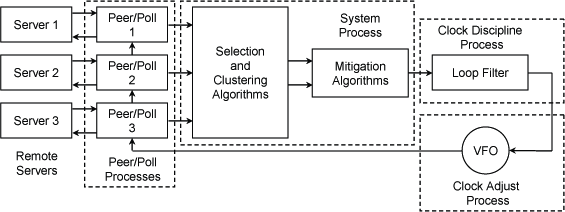 [Source: http://www.eecis.udel.edu/~mills/ntp/html/warp.html – a cleaned up copy of the original text-graphics version of Figure 2 in RFC5905] Secondly, to avoid overwhelming the NTP servers, the default polling interval is 64 seconds, so it takes a while to build up the database – and in my case, well before the clock was finally synchronised I could see the database building: (by the way, it took 13 minutes to synchronise)
router#show ntp association

  address         ref clock       st   when   poll reach  delay  offset   disp
 ~27.54.95.11     .INIT.          16      -     64     0  0.000   0.000 15937.
 ~130.102.128.23  216.218.254.20   2     57     64     1 51.977 104342. 7937.5
 ~128.184.34.53   169.254.0.1      3     61     64     1 49.092 104342. 7937.5
 ~129.250.35.250  133.243.238.24   2     13     64     3 261.55 104321. 3937.9
 ~129.250.35.251  133.243.238.24   2     46     64     1 255.13 104329. 7937.5
 * sys.peer, # selected, + candidate, - outlyer, x falseticker, ~ configured

router#show ntp status
Clock is unsynchronized, stratum 16, no reference clock
nominal freq is 250.0000 Hz, actual freq is 250.0000 Hz, precision is 2**32
reference time is 00000000.00000000 (10:00:00.000 UTC+10 Mon Jan 1 1900)
clock offset is 0.0000 msec, root delay is 0.00 msec
root dispersion is 0.01 msec, peer dispersion is 0.00 msec
loopfilter state is 'FSET' (Drift set from file), drift is 0.000000000 s/s
system poll interval is 64, never updated.
I can now see that the stratum and when columns for my ntp servers show that some of the servers have been contacted, and indeed are of varying status – a stratum 2 server is considered to be more accurate than a stratum 3. In fact, stratum 3 servers synchronise with stratum 2 servers, stratum 2 servers synchronise with stratum 1 and stratum 0 servers are the atomic clocks that drive the whole system. [ref] A stratum of 16 indicates that the device is unsynchronised – so it looks like my first choice of ntp server (pool.ntp.org) is not giving up any information. I can also tell from the output of the show ntp association command how many of the last polls have been successful, but to do this I have to understand that the reach column displays its output in octal, then translate that to binary. The binary bit pattern then shows the status of the last 8 polls. Not too hard for the output above, the 0 indicating there has never been a successful poll, the 1 indicating the last poll was successful, and 3 (00000011 in binary) show the last two polls were successful. When this number shows 377 (octal) it means the last 8 polls were good. But I can also see values appearing in the delay, offset, and dispersion columns, showing that NTP is building its database. Delay is the round-trip delay in ms, and offset is clock time difference between the peers or between the master and client. This value is the correction that is applied to a client clock in order to synchronize it. A positive value indicates the server clock is higher. A negative value indicates the client clock is higher. Dispersion, reported in seconds, is the maximum clock time difference that was ever observed between the local clock and server clock. This value should come down over time, and if it ever reaches 16000, the client will not accept the time from that server. [ref]. After thirteen minutes of impatience, I finally saw what I was looking for (from the output of debug ntp all🙂
Jun 17 01:20:15.337: NTP Core(INFO): system event 'event_sync_chg' (0x03) status 'leap_none, sync_ntp, 6 events, event_peer/strat_chg' (0x664)
Jun 17 01:20:15.337: NTP Core(NOTICE): Clock is synchronized.
And a look at the status finally shows that the clock is synchronised:
router#show ntp status
Clock is synchronized, stratum 3, reference is 129.250.35.250
nominal freq is 250.0000 Hz, actual freq is 250.0000 Hz, precision is 2**32
reference time is D74A164F.57258397 (11:20:15.340 UTC+10 Tue Jun 17 2014)
clock offset is 0.0079 msec, root delay is 0.26 msec
root dispersion is 0.48 msec, peer dispersion is 0.06 msec
loopfilter state is 'CTRL' (Normal Controlled Loop), drift is 0.000000030 s/s
system poll interval is 64, last update was 139 sec ago.
Now my NTP has synchronised, but that is not the end of the story. By repeating the show ntp association command periodically, you can see things are still happening.
router#show ntp association

  address         ref clock       st   when   poll reach  delay  offset   disp
 ~27.54.95.11     .STEP.          16      -     64     0  0.000   0.000 15937.
+~130.102.128.23  216.218.254.20   2     25     64    77 51.267  32.537 189.39
 ~128.184.34.53   169.254.0.1      3     64     64   122 49.115  29.474 1939.5
*~129.250.35.250  133.243.238.24   2     14     64   177 261.47   7.906 65.514
+~129.250.35.251  133.243.238.24   2     55     64    77 255.70  13.942 190.86
 * sys.peer, # selected, + candidate, - outlyer, x falseticker, ~ configured
The first change I noticed was that the unreachable server changed its output from .INIT. to .STEP. in the ref clock column. I’m not sure what this means, but I’m trying to find out. Next, I saw that some of the peers had + and * markers next to them, indicating that they were being considered in the time calculation. With NTP, multiple candidates can be combined to minimise the accumulated error. And I also noticed that the reachability numbers were steadily increasing, remembering that 0o77 is 0b00111111, 0o177 is 0b01111111 and 0o122 is 0b01010010, then we can see that the server reporting the 122 is missing a few replies – and note that it has not been selected as a candidate. Over time I continued observing the output of show ntp association
router#show ntp association

  address         ref clock       st   when   poll reach  delay  offset   disp
 ~27.54.95.11     .STEP.          16      -   1024     0  0.000   0.000 15937.
+~130.102.128.23  216.218.192.20   2     33     64   377 51.168  45.696  3.644
-~128.184.34.53   169.254.0.1      3     14     64   377 48.056  49.073  1.733
+~129.250.35.250  133.243.238.24   2     26     64   377 261.09  25.027  3.675
*~129.250.35.251  133.243.238.24   2      4     64   377 254.66  34.519  2.626
 * sys.peer, # selected, + candidate, - outlyer, x falseticker, ~ configured
Note that the last four servers have had the past eight queries replied to (because the reachability is 0o377 or 0b11111111 in binary) but the 128.184.34.53 server is still not considered a candidate, but an outlyer (normally spelled outlier) that will not be considered in the calculation. The next time I looked, I could see that the polling interval had changed to 128 seconds for the last four servers.
router#show ntp association

  address         ref clock       st   when   poll reach  delay  offset   disp
 ~27.54.95.11     .STEP.          16      -   1024     0  0.000   0.000 15937.
+~130.102.128.23  216.218.254.20   2     59    128   377 51.895  54.913  6.592
-~128.184.34.53   169.254.0.1      3    110    128    55 49.449  56.680 196.53
*~129.250.35.250  133.243.238.24   2    121    128   377 261.25  36.705  4.196
+~129.250.35.251  133.243.238.24   2     98    128   377 256.22  41.049  7.129
 * sys.peer, # selected, + candidate, - outlyer, x falseticker, ~ configured
This change of polling interval is part of the normal process. When things have completely settled down, I expect this to read 1024 for all servers. Although I do note that the 128.184.34.53 server is back to dropping a few replies. However, that doesn’t seem to matter that much, because next time I looked I saw that this server had become a candidate server and 129.250.35.250 had dropped to being an outlyer(sic).
router#show ntp association

  address         ref clock       st   when   poll reach  delay  offset   disp
 ~27.54.95.11     .STEP.          16      -   1024     0  0.000   0.000 15937.
+~130.102.128.23  216.218.254.20   2     41    128   377 50.666  61.893  4.294
+~128.184.34.53   169.254.0.1      3     94    128   157 49.045  61.049 69.038
-~129.250.35.250  133.243.238.24   2    100    128   377 261.25  36.705  7.135
*~129.250.35.251  133.243.238.24   2     77    128   377 256.23  51.167  3.032
 * sys.peer, # selected, + candidate, - outlyer, x falseticker, ~ configured
To understand why this change had taken place is still way beyond my understanding. I tried to read RFC 5905 but had to stop before my head exploded. As the day wore on, the polling interval gradually increased and the candidate servers changed around a bit. This was the situation about 90 mins after I first configured NTP:
router#show ntp association

  address         ref clock       st   when   poll reach  delay  offset   disp
 ~27.54.95.11     .STEP.          16      -   1024     0  0.000   0.000 15937.
-~130.102.128.23  132.163.4.101    2     14    256   377 51.692  80.578  8.526
+~128.184.34.53   169.254.0.1      3    196    256   377 49.238  68.183  7.904
+~129.250.35.250  133.243.238.24   2    200    256   377 261.65  55.852  5.636
*~129.250.35.251  133.243.238.24   2     47    256   377 255.26  66.107  8.174
 * sys.peer, # selected, + candidate, - outlyer, x falseticker, ~ configured
And then something interesting turned up in the debug, at about the 2 hour mark. The recalcitrant NTP server at 27.54.95.11 became social:
Jun 17 03:30:47.154: NTP message sent to 27.54.95.11, from interface 'Dialer1' (58.105.232.94).
Jun 17 03:30:47.238: NTP message received from 27.54.95.11 on interface 'Dialer1' (58.105.232.94).
And sure enough, 1024 seconds (17 minutes) later:
Jun 17 03:30:47.154: NTP message sent to 27.54.95.11, from interface 'Dialer1' (58.105.232.94).
Jun 17 03:30:47.238: NTP message received from 27.54.95.11 on interface 'Dialer1' (58.105.232.94).
The next message was only 512 seconds later, so clearly the polling interval was changed:
un 17 03:56:23.164: NTP message sent to 27.54.95.11, from interface 'Dialer1' (58.105.232.94).
Jun 17 03:56:23.248: NTP message received from 27.54.95.11 on interface 'Dialer1' (58.105.232.94).
And after six successful polls, the story looked like this:
router#show ntp association

  address         ref clock       st   when   poll reach  delay  offset   disp
+~27.54.95.11     101.231.167.21   2    489    512   177 84.762 151.517 70.749
*~130.102.128.23  216.218.192.20   2    219    512   377 51.678 155.438 11.281
+~128.184.34.53   169.254.0.1      3    144    512   377 49.342 151.303 12.239
-~129.250.35.250  133.243.238.24   2    154    512   377 262.04 140.283  7.412
-~129.250.35.251  133.243.238.24   2      9    512   377 256.34 144.174  9.323
 * sys.peer, # selected, + candidate, - outlyer, x falseticker, ~ configured
Note that the newly connected server has become a candidate already! By now (it’s five hours since I setup the NTP) all servers are talking, and for the first time I have seen more than two candidate servers and a system peer.
router#show ntp association

  address         ref clock       st   when   poll reach  delay  offset   disp
+~27.54.95.11     101.231.167.21   2    113   1024   327 85.808 249.651 14.515
*~130.102.128.23  216.218.254.20   2    360   1024   377 51.738 251.118 18.597
+~128.184.34.53   169.254.0.1      3    287   1024   177 51.886 246.250 17.000
-~129.250.35.250  133.243.238.24   2    297   1024   377 269.41 219.283 16.942
+~129.250.35.251  133.243.238.24   2    663   1024   377 255.84 235.492 13.132
 * sys.peer, # selected, + candidate, - outlyer, x falseticker, ~ configured
Note that the polling has stepped to 1024 seconds, which means we only poll each of these servers every 17 minutes, and we’ve only lost a couple of polls, as indicated by the 327 and 177 values in the reachability column.
The Hardware Clock
This whole exercise started because I noticed that my clock was about half an hour out. By default, your router gets its time from its internal hardware clock when it boots up. [ref]. To allow NTP to update my hardware clock, I added the following to my configuration:
ntp update calendar
Conclusion
I now have a fairly stable NTP environment – and the key things that tell me that from the output of show ntp association are:
- There are multiple servers configured. NTP works best with several servers.
- At least one NTP candidate (indicated by a + to the left of the peer address) or a system peer (indicated by a * to the left of the peer address – sometimes called a master) must exist before your clock will synchronise
- The stratum of at least some of those servers is fairly low – the closer to 0 the better
- The polling interval has stepped back to 1024 seconds on all servers, indicting that the system has enough information to poll infrequently
- The reachability for most servers is showing 377, meaning the past eight polls have been successful.
So you can see that NTP is not just a simple protocol that gets it time from a single lookup. There is a simpler implementation of NTP called SNTP, and I could have configured that instead, but I couldn’t have configured both NTP and SNTP at the same time. Understanding that you need to configure MULTIPLE servers and getting to understand the output of the show ntp association command are the key points I hope I’ve made. RedNectar Reading: http://packetlife.net/blog/2011/mar/28/cisco-ios-clocks-and-ntp/ http://www.eecis.udel.edu/~mills/ntp/html/warp.html http://www.cisco.com/c/en/us/support/docs/ip/network-time-protocol-ntp/116161-trouble-ntp-00.html http://www.cisco.com/c/en/us/support/docs/availability/high-availability/19643-ntpm.html http://www.cisco.com/c/en/us/support/docs/ios-nx-os-software/ios-software-releases-110/15171-ntpassoc.html http://www.cisco.com/c/en/us/td/docs/ios-xml/ios/bsm/configuration/12-4t/bsm-12-4t-book/bsm-time-calendar-set.html http://en.wikipedia.org/wiki/Network_Time_Protocol http://www.ciscopress.com/articles/article.asp?p=2013217&seqNum=2 http://www.ntp.org/ntpfaq/NTP-s-def.htm
